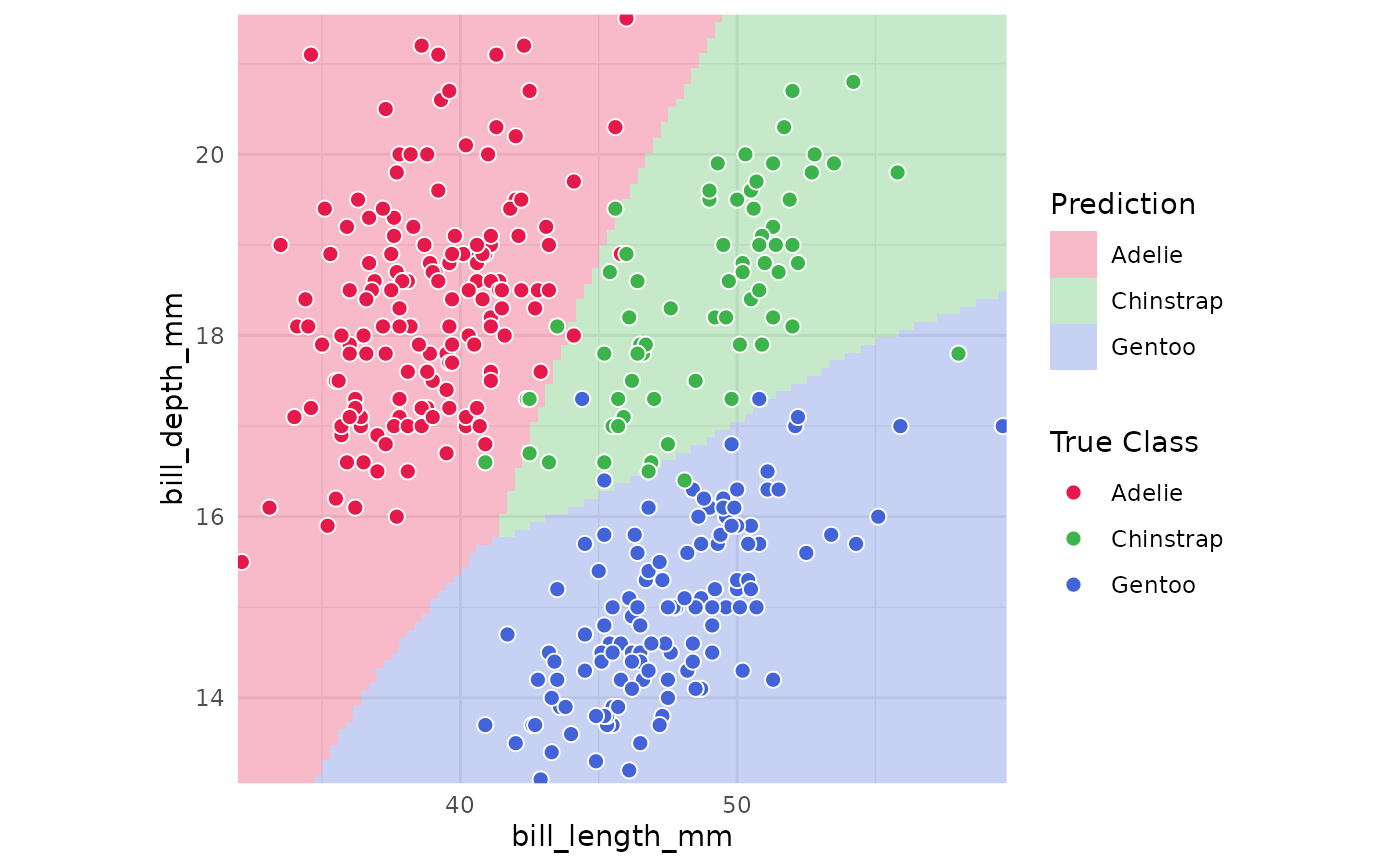
A high-level unified wrapper to fit a model, compute its 2D decision boundary, and plot the results in a single step.
Arguments
- data
A data frame containing the full training dataset. The specific variables used for modeling and plotting are strictly determined by the
formula.- formula
A formula specifying the response and predictors.
- classifier
The classification function to use (e.g.,
rpart::rpart,e1071::svm). This works with any R package classification algorithm. If the classifier uses a non-standard API, you can adapt it via thepredfunargument.- interface
A string specifying how to invoke the classifier:
"formula","matrix", or"custom".- projection
An optional list (e.g.,
list(basis=..., center=..., scale=...)) specifying a 2D projection for high-dimensional data.- fit_args
A named list of additional arguments passed to the classifier during fitting.
- predict_args
A named list of additional arguments passed to
predict()during boundary computation.- predfun
A custom function to generate predictions for non-standard models.
- resolution
An integer specifying the grid resolution for the decision boundary.
- ...
Additional arguments passed to
plot_boundary.